


Cat Data Tracking – How far do Griffin and Phoenix Travel?
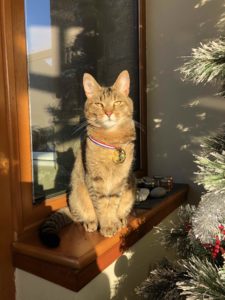
I have two cats called Griffin and Phoenix. They are two year old brothers (at least in human years – by cat years they are rowdy teenagers). Griffin has the white bib and Phoenix is the sandy coloured tabby.

We often wonder what the cats do when they’re not lying in the living room. Are the cats lazy stay-at-homes? Or are they wanderers like savannah lions? Data science is here to help. I’ll use the PPDAC data problem solving cycle to get more insight into what those dreadful animals get up to. PPDAC stands for Problem, Plan, Data, Analysis and Conclusions.
Problem
I came up with a list of questions which I was curious about. The answers will help me to decide the stay-at-home/savannah lion overall question.
- Which cat is more active?
- Where do the cats go?
- How far do they travel?
- Do they go about together or do they have their own territories?
Plan
I decided to buy two Pawtrack (https://pawtrack.com) devices, one for each cat. These are lightweight black collars which you can clip on instead of the cat’s regular collar. It tracks the cats’ position using GPS (or your Wi-fi if the cat happens to be within range). There is an app which allows you to track your cat’s location in real time, but this particular brand enables you to download a file containing all the cat’s data for the last 24 hours. This is why I chose it, of course. I wanted to get my hands on the glorious data.
Image from https://pawtrack.com
I planned to put the collars on the cats for at least a week in November 2019 and download the data from the collar each day.
An ethical issue I considered while planning was to be careful about publishing location data which would make it too obvious where I live, particularly if children or young people ever do a similar project in school. (If you’re thinking that schools don’t have cats, I can reveal that our local high school does. I don’t think it is an official job title but it does wander the grounds and corridors. Also, may I introduce Edinburgh University Library Cat? https://www.amazon.co.uk/Library-Cat-Observations-Edinburgh-University-ebook/dp/B01B7443Z0)
Another ethical consideration was the cats’ reactions. If they were uncomfortable in their collars, or if the collars seemed too heavy, I planned to take them off. I also decided to collect data for a period of a week and then put their normal collars back on because the normal ones are slightly lighter. It turned out that the cats totally ignored their new collars and went about their normal business. This wouldn’t have been true for previous cats of mine who were altogether more scratchy about collars.
(Note: if you would like to try this, you can borrow the cat collars from the Data Education in Schools technology lending library. Cats not supplied.)
Data
The data file contains a series of data points which stores: cat name, time/date, longitude, latitude. I set it to check the GPS position every six minutes, but I suspect it filters out duplicates when the cat is just lying about in its hammock. It also has information about battery level. It doesn’t directly record distance or speed as a human activity tracker would.
Having collected the data, I discovered that the battery levels were low (on the collars, not the cats) for a few of them, so I removed the data from a few days, leaving 5 days of useable data.
I viewed the data in the Pawtrack app initially to get a quick idea of where the cats go. I also loaded it into Tableau and Codapp to refresh my memory of those packages. Both gave me easy, clear visualisations of the cats’ routes. However, I realised that extracting the distance travelled from the longitude and latitude data would not be straightforward from a point and click package, so I decided to use an R library for geodistance to work this out because I already knew R from previous projects. I used the geosphere, ggmap and ggplot2 libraries, and many thanks indeed to the kind people who wrote them. Let me know if you’d like to borrow my R code.
Analysis
Where did the cats go?
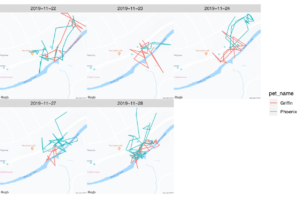
My family were most curious about where the cats actually go, so let’s start with that. We live by a river, with a large woodland area leading to the hills on one side of the garden. We always assumed that the cats would go hunting there rather than crossing the main road and wandering around the housing estate. Wrong! Below you can see the maps for the five days I got good data (each little map in the image is called a facet). Each little blue dot shows a location which Phoenix visited, and each red dot was visited by Griffin. Both cats spend a lot of time across the main road, prowling around the back gardens (or eating additional dinners like Six Dinners Sid). Griffin was more likely to patrol the river, and on 23/11/19 strolled across the bridge, and up into the woodland. On 22/11, Phoenix hung around the café (draw your own conclusions).
It’s interesting to look at the animation provided by Pawtrack which shows the order of the points the cats visit over time. It is clear from that that Phoenix in particular retraces his steps a lot, and that they come back home in between outings. A heatmap provided by Pawtrack shows that they have favourite spots where they loiter for a while. It’s not like they decide they’ll go for a walk, pack their rucksacks and follow a map along a sensible route.
(Note: I used the Google map API from R to draw the maps with the setting style = ‘feature:road|element:labels|visibility:off to remove the street names. If it is important to you, you could also remove the river name and the café name.)
How far did they walk?
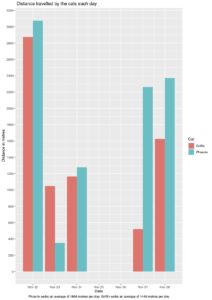
The chart below shows how far each cat travelled on each date. (The battery levels were too low on 25th/26thNovember which is why those dates are blank). Phoenix went further almost every day, and walked on average 1855 metres per day compared to Griffin’s 1446 metres. For those of you who prefer miles, a mile is 1600m. The 22nd of November was an active day for both cats, with Phoenix going about 3.1km.
So the cats go roughly about a mile a day, and Phoenix goes about quarter of a mile further than his brother. Given the GPS is sometimes inaccurate, and the difference is small, I am not yet convinced that Phoenix is really much more active. I’d rather look at the data for a longer time period to check. We also don’t know how fast they go. But let’s not detract from Phoenix’s triumph, and congratulate him on his win! No wonder he is almost always asleep at home.
Conclusions
Are the cats lazy stay-at-homes or wanderers like savannah lions? It looks like they are wanderers (although they also spend a lot of time resting at home after their exertions). In this particular 5 days, Phoenix happened to travel further than Griffin. They have overlapping territories but Griffin spends more time by the river and woods. They travel about one mile on average per 24 hours, which is not bad considering they only have short little cat legs.
As is often the case with data science, finding the answers has made me curious about more questions. The next time I work on this project, I want to find out:
- Are the cats more active at different times of year?
- Are they more active at night?
- Does the weather affect how active they are?
Author: Professor Judy Robertson