


Introduction
We are going to create our very own family infographic. An infographic is a visual representation of data. It can include pictures, words and numbers to help us understand something.
To create our infographic we are going to:
- find out what data is and what an infographic is
- collect data about our family and friends
- organise our data
- create an infographic with our data
What do you need?
Ideally children will have access to paper and pencils.
You do not need any special equipment.
During the activity you will use objects in your home and any you find when you are outside for example on a walk or playing games or visiting the shops.
Let’s get started!
Follow these steps to learn more about data and to create your very own infographic
- Watch this Sway to find out more about data and infographics
- Use this activity guide to start collecting the data for your family infographic.
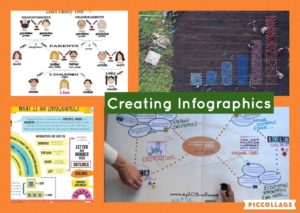
- Now it is time to create your infographic! Have a look at these examples to give you an idea of what you can do.
More about Data Science
If you have enjoyed creating your infographic why not watch a video about Data Science and then take a look at our other resources <LINK>